Note
Go to the end to download the full example code
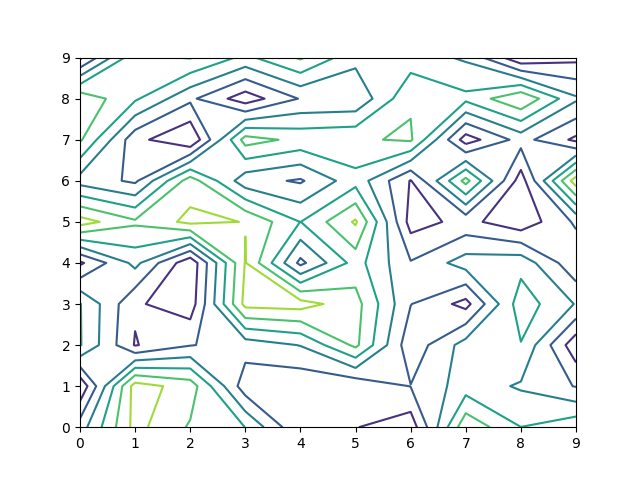
Contour plots#
Contour plot support is limited to picking the individual
LineCollections, which are directly
registered with the axes and thus picked up by mplcursors.cursor
(QuadContourSets are not even artists, which make
them hard to handle without additional special-casing). It remains possible to
retrieve the z value and add it manually to the annotation, though.
import numpy as np
import matplotlib.pyplot as plt
import mplcursors

np.random.seed(42)

fig, ax = plt.subplots()
cf = ax.contour(np.random.random((10, 10)))
cursor = mplcursors.cursor()

@cursor.connect("add")
def on_add(sel):
    ann = sel.annotation
    # `cf.collections.index(sel.artist)` is the index of the selected line
    # among all those that form the contour plot.
    # `cf.cvalues[...]` is the corresponding value.
    ann.set_text("{}\nz={:.3g}".format(
        ann.get_text(), cf.cvalues[cf.collections.index(sel.artist)]))

plt.show()