Note
Go to the end to download the full example code.
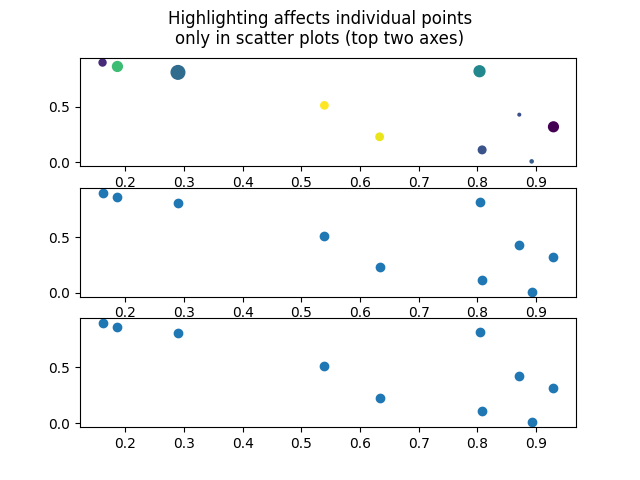
Scatter plots are highlighted point-by-point.#
… as opposed to lines with a "." style, which have the same appearance,
but are highlighted as a whole.
import numpy as np
import matplotlib.pyplot as plt
import mplcursors

x, y, z = np.random.random((3, 10))
fig, axs = plt.subplots(3)
fig.suptitle("Highlighting affects individual points\n"
             "only in scatter plots (top two axes)")
axs[0].scatter(x, y, c=z, s=100 * np.random.random(10))
axs[1].scatter(x, y)
axs[2].plot(x, y, "o")
mplcursors.cursor(highlight=True)
plt.show()