Note
Go to the end to download the full example code.
Display an artist’s label instead of x, y coordinates#
Use an event handler to change the annotation text.
import numpy as np
import matplotlib.pyplot as plt
import mplcursors
x = np.linspace(0, 10, 100)
fig, ax = plt.subplots()
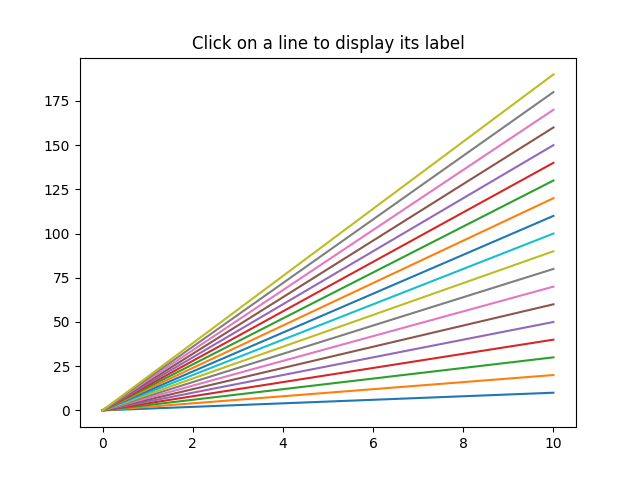
ax.set_title("Click on a line to display its label")
# Plot a series of lines with increasing slopes.
for i in range(1, 20):
ax.plot(x, i * x, label=f"$y = {i}x$")
# Use a Cursor to interactively display the label for a selected line.
mplcursors.cursor().connect(
"add", lambda sel: sel.annotation.set_text(sel.artist.get_label()))
plt.show()