mplcursors – Interactive data selection cursors for Matplotlib#

mplcursors provides interactive data selection cursors for Matplotlib.
It is inspired from mpldatacursor, with a much simplified API.
mplcursors requires Matplotlib≥3.1.
Installation#
Pick one among:
$ pip install mplcursors  # from PyPI
$ pip install git+https://github.com/anntzer/mplcursors  # from Github
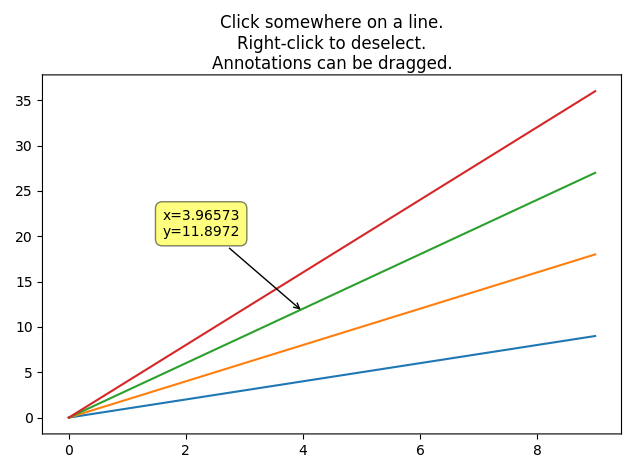
Basic example#
Basic examples work similarly to mpldatacursor:
import matplotlib.pyplot as plt
import numpy as np
import mplcursors

data = np.outer(range(10), range(1, 5))

fig, ax = plt.subplots()
lines = ax.plot(data)
ax.set_title("Click somewhere on a line.\nRight-click to deselect.\n"
             "Annotations can be dragged.")

mplcursors.cursor(lines)  # or just mplcursors.cursor()

plt.show()
The cursor convenience function makes a collection of artists selectable.
Specifically, its first argument can either be a list of artists or axes (in
which case all artists in each of the axes become selectable); or one can just
pass no argument, in which case all artists in all figures become selectable.
Other arguments (which are all keyword-only) allow for basic customization of
the Cursor’s behavior; please refer to that class’ documentation.
Activation by environment variable#
To globally configure the use of mplcursors, set the
MPLCURSORS environment variable to a JSON-encoded dict, and add
"mplcursors:install" to mpl.rcParams["figure.hooks"] (this requires
Matplotlib≥3.7). This hook arranges for a cursor to be registered on
each figure the first time it is drawn, passing the options specified in
MPLCURSORS to cursor.
$ MPLCURSORS={} python foo.py
and:
$ MPLCURSORS='{"hover": 1}' python foo.py
Note that this will not pick up artists added to the figure after the first draw, e.g. when working interactively or when artists are added through interactive callbacks.
In earlier versions, registration in mpl.rcParams["figure.hooks"] was not
needed; the behavior has changed because that implementation led to complex
interactions with setuptools and the import machinery.
Default UI#
A left click on a line (a point, for plots where the data points are not connected) creates a draggable annotation there. Only one annotation is displayed (per
Cursorinstance), except if themultiplekeyword argument was set.A right click on an existing annotation will remove it.
Clicks do not trigger annotations if the zoom or pan tool are active. It is possible to bypass this by double-clicking instead.
For annotations pointing to lines or images, Shift-Left and Shift-Right move the cursor “left” or “right” by one data point. For annotations pointing to images, Shift-Up and Shift-Down are likewise available.
v toggles the visibility of the existing annotation(s).
e toggles whether the
Cursoris active at all (if not, no event other than re-activation is propagated).
These bindings are all customizable via Cursor’s bindings keyword
argument. Note that the keyboard bindings are only active if the canvas has
the keyboard input focus.
Customization#
Instead of providing a host of keyword arguments in Cursor’s constructor,
mplcursors represents selections as Selection objects and lets you
hook into their addition and removal.
Specifically, a Selection has the following fields:
artist: the selected artist,target: the(x, y)coordinates of the point picked within the artist.index: an index of the selected point, within the artist data, as detailed below.dist: the distance from the point clicked to thetarget(mostly used to decide which artist to select).annotation: a MatplotlibAnnotationobject.extras: an additional list of artists, that will be removed whenever the mainannotationis deselected.
The exact meaning of index depends on the selected artist:
For
Line2Ds, the integer part ofindexis the index of segment where the selection is, and its fractional part indicates where the selection is within that segment.For step plots (i.e., created by
plt.steporplt.plot(..., drawstyle="steps-..."), we return a specialIndexobject, with attributesint(the segment index),x(how far the point has advanced in thexdirection) andy(how far the point has advanced in theydirection). See Step plots for an example.On polar plots, lines can be either drawn with a “straight” connection between two points (in screen space), or “curved” (i.e., using linear interpolation in data space). In the first case, the fractional part of the index is defined as for cartesian plots. In the second case, the index in computed first on the interpolated path, then divided by the interpolation factor (i.e., pretending that each interpolated segment advances the same index by the same amount).
For
AxesImages,indexare the(y, x)indices of the selected point, such thatdata[y, x]is the value at that point (note that the indices are thus in reverse order compared to the(x, y)target coordinates!).For
Containers,indexis the index of the selected sub-artist.For
LineCollections andPathCollections,indexis a pair: the index of the selected line, and the index within the line, as defined above.
(Note that although Selection is implemented as a namedtuple, only the field
names should be considered stable API. The number and order of fields is
subject to change with no notice.)
Thus, in order to customize, e.g., the annotation text, one can call:
lines = ax.plot(range(3), range(3), "o")
labels = ["a", "b", "c"]
cursor = mplcursors.cursor(lines)
cursor.connect(
    "add", lambda sel: sel.annotation.set_text(labels[sel.index]))
Whenever a point is selected (resp. deselected), the "add" (resp.
"remove") event is triggered and the registered callbacks are executed,
with the Selection as only argument. Here, the only callback updates the
text of the annotation to a per-point label. (cursor.connect("add") can
also be used as a decorator to register a callback, see below for an example.)
For an example using pandas’ DataFrames, see
Extracting data and labels from a DataFrame.
For additional examples of customization of the position and appearance of the annotation, see Display a bar’s height and name on top of it upon hovering and Changing properties of the popup.
Note
When the callback is fired, the position of the annotating text is
temporarily set to (nan, nan). This allows us to track whether a
callback explicitly sets this position, and, if none does, automatically
compute a suitable position.
Likewise, if the text alignment is not explicitly set but the position is, then a suitable alignment will be automatically computed.
Callbacks can also be used to make additional changes to the figure when
a selection occurs. For example, the following snippet (extracted from
Linked artists) ensures that whenever an artist is selected,
another artist that has been “paired” with it (via the pairs map) also gets
selected:
@cursor.connect("add")
def on_add(sel):
    sel.extras.append(cursor.add_highlight(pairs[sel.artist]))
Note that the paired artist will also get de-highlighted when the “first” artist is deselected.
In order to set the status bar text from a callback, it may be helpful to clear it during “normal” mouse motion, e.g.:
fig.canvas.mpl_connect(
    "motion_notify_event",
    lambda event: fig.canvas.toolbar.set_message(""))
cursor = mplcursors.cursor(hover=True)
cursor.connect(
    "add",
    lambda sel: fig.canvas.toolbar.set_message(
        sel.annotation.get_text().replace("\n", "; ")))
Complex plots#
Some complex plots, such as contour plots, may be partially supported,
or not at all. Typically, it is because they do not subclass
Artist, and thus appear to cursor as a collection
of independent artists (each contour level, in the case of contour plots).
It is usually possible, again, to hook the "add" signal to provide
additional information in the annotation text. See Contour plots for an
example.
Animations#
Matplotlib’s animation blitting mode assumes that the animation
object is entirely in charge of deciding what artists to draw and when. In
particular, this means that the animated property is set on certain
artists. As a result, when mplcursors tries to blit an animation on
top of the image, the animated artists will not be drawn, and disappear. More
importantly, it also means that once an annotation is added, mplcursors
cannot remove it (as it needs to know what artists to redraw to restore the
original state).
As a workaround, either switch off blitting, or unset the animated
property on the relevant artists before using a cursor. (The only other
fix I can envision is to walk the entire tree of artists, record their
visibility status, and try to later restore them; but this would fail for
ArtistAnimations which themselves fiddle with
artist visibility).