Note
Go to the end to download the full example code.
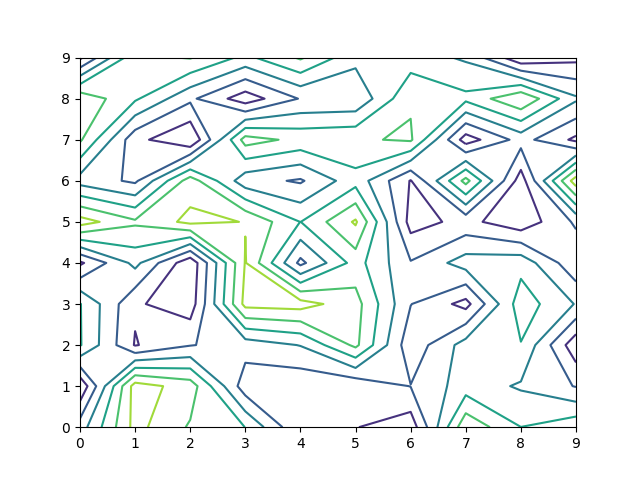
Contour plots#
Picking contour plots is supported on Matplotlib≥3.8.
import numpy as np
import matplotlib.pyplot as plt
import mplcursors

fig, axs = plt.subplots(2, 2, figsize=(10, 4), sharex=True, sharey=True)

ii, jj = np.ogrid[:100, :100]
img = np.cos(ii / 20) * np.sin(jj / 10)
c = axs[0, 0].contour(img)
fig.colorbar(c, orientation="horizontal")
c = axs[0, 1].contourf(img)
fig.colorbar(c, orientation="horizontal")

ii, jj = np.random.rand(2, 1000) * 100
img = np.cos(ii / 20) * np.sin(jj / 10)
c = axs[1, 0].tricontour(jj, ii, img)
fig.colorbar(c, orientation="horizontal")
c = axs[1, 1].tricontourf(jj, ii, img)
fig.colorbar(c, orientation="horizontal")

mplcursors.cursor()

plt.show()