Note
Go to the end to download the full example code.
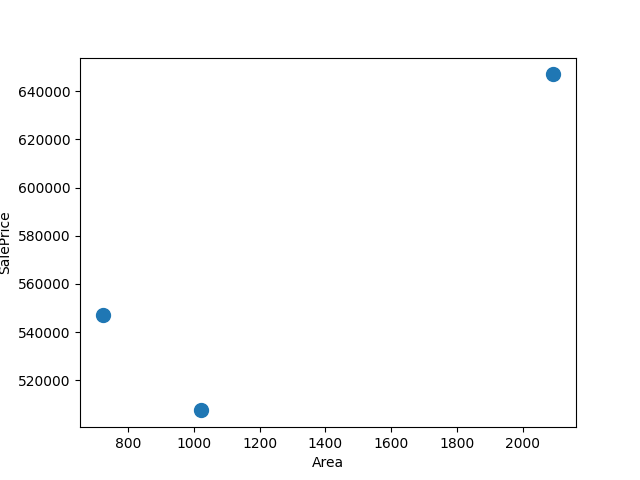
Extracting data and labels from a DataFrame#
DataFrames can be used similarly to any other kind of input.
Here, we generate a scatter plot using two columns and label the points using
all columns.
This example also applies a shadow effect to the hover panel.
from matplotlib import pyplot as plt

from matplotlib.patheffects import withSimplePatchShadow
import mplcursors
from pandas import DataFrame


df = DataFrame(
    dict(
        Suburb=["Ames", "Somerset", "Sawyer"],
        Area=[1023, 2093, 723],
        SalePrice=[507500, 647000, 546999],
    )
)

df.plot.scatter(x="Area", y="SalePrice", s=100)


def show_hover_panel(get_text_func=None):
    cursor = mplcursors.cursor(
        hover=2,  # Transient
        annotation_kwargs=dict(
            bbox=dict(
                boxstyle="square,pad=0.5",
                facecolor="white",
                edgecolor="#ddd",
                linewidth=0.5,
                path_effects=[withSimplePatchShadow(offset=(1.5, -1.5))],
            ),
            linespacing=1.5,
            arrowprops=None,
        ),
        highlight=True,
        highlight_kwargs=dict(linewidth=2),
    )

    if get_text_func:
        cursor.connect(
            event="add",
            func=lambda sel: sel.annotation.set_text(get_text_func(sel.index)),
        )

    return cursor


def on_add(index):
    item = df.iloc[index]
    parts = [
        f"Suburb: {item.Suburb}",
        f"Area: {item.Area:,.0f}m²",
        f"Sale price: ${item.SalePrice:,.0f}",
    ]

    return "\n".join(parts)


show_hover_panel(on_add)

plt.show()

# test: skip