Note
Go to the end to download the full example code.
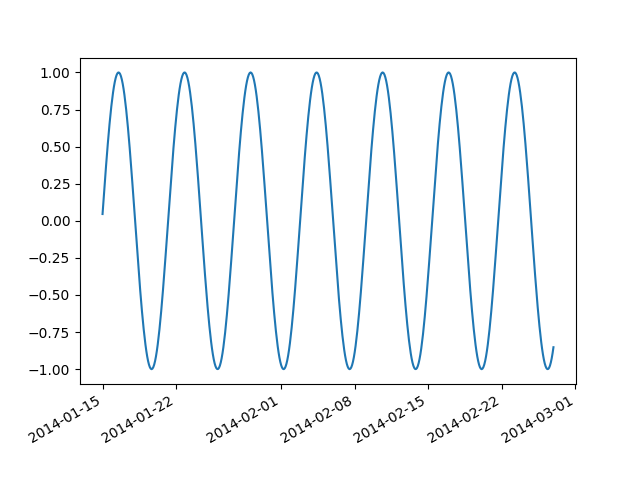
Datetime data#
mplcursors correctly formats datetime data.
import datetime as dt
import numpy as np
import matplotlib.pyplot as plt
import matplotlib.dates as mdates
import mplcursors

t = mdates.drange(dt.datetime(2014, 1, 15), dt.datetime(2014, 2, 27),
                  dt.timedelta(hours=2))
y = np.sin(t)
fig, ax = plt.subplots()
ax.plot(mdates.num2date(t), y, "-")

# Note that mplcursors will automatically display the x-values as dates.
mplcursors.cursor()

plt.show()